The trading journal that actually works: five columns
Most journals die in week two. Five columns are enough to show which of your decisions make money and which ones leak it.
Most trading journals die in week two. They start with twenty columns, screenshots, mood ratings and a paragraph per trade, and by the second losing streak nobody fills them in anymore. A journal only needs to answer one question: which of your decisions make money and which ones lose it? Five columns are enough to answer that, and five columns are cheap enough to keep going for a year.
The short version
- Record five things per trade: setup name, grade before entry, result in R, whether you followed the plan, and the session hour.
- After 50 trades, total the R by each column. The leak shows itself.
- Fill it in right after each trade, review it weekly, never daily.
The five columns
1. Setup name
London Breakout, VWAP pullback, order block retest, sweep short. If you can’t name it, it wasn’t a setup, it was a feeling. This column alone cuts a surprising number of trades, because writing “no setup, just looked good” in black and white is uncomfortable.
2. Grade before entry
A, B or C, written before you click. A means every rule of the setup is met in the right session with room to target. B means one condition is soft. C means you’re stretching. This is the column that exposes you, because it records what you thought of the trade before the result could change your mind.
3. Result in R
Not in dollars. R is the result divided by the amount you risked. A trade risking $50 that makes $100 is +2R. A trade that hits its stop is −1R. R makes a $20 trade and a $200 trade comparable, so a bigger account or a bigger week doesn’t distort the picture. It also exposes oversized losers immediately: a −2.6R loss means the stop was moved or the size was wrong.
4. Followed the plan?
Yes or no. Did you move the stop, add size, exit early, or enter before the candle closed? Be strict. “Mostly” is no.
5. Session and hour
When the trade was opened, in UTC. London open, New York open, the lunch lull, the late-night revenge window. This column tells you when to trade and when to switch the platform off.
What a page looks like
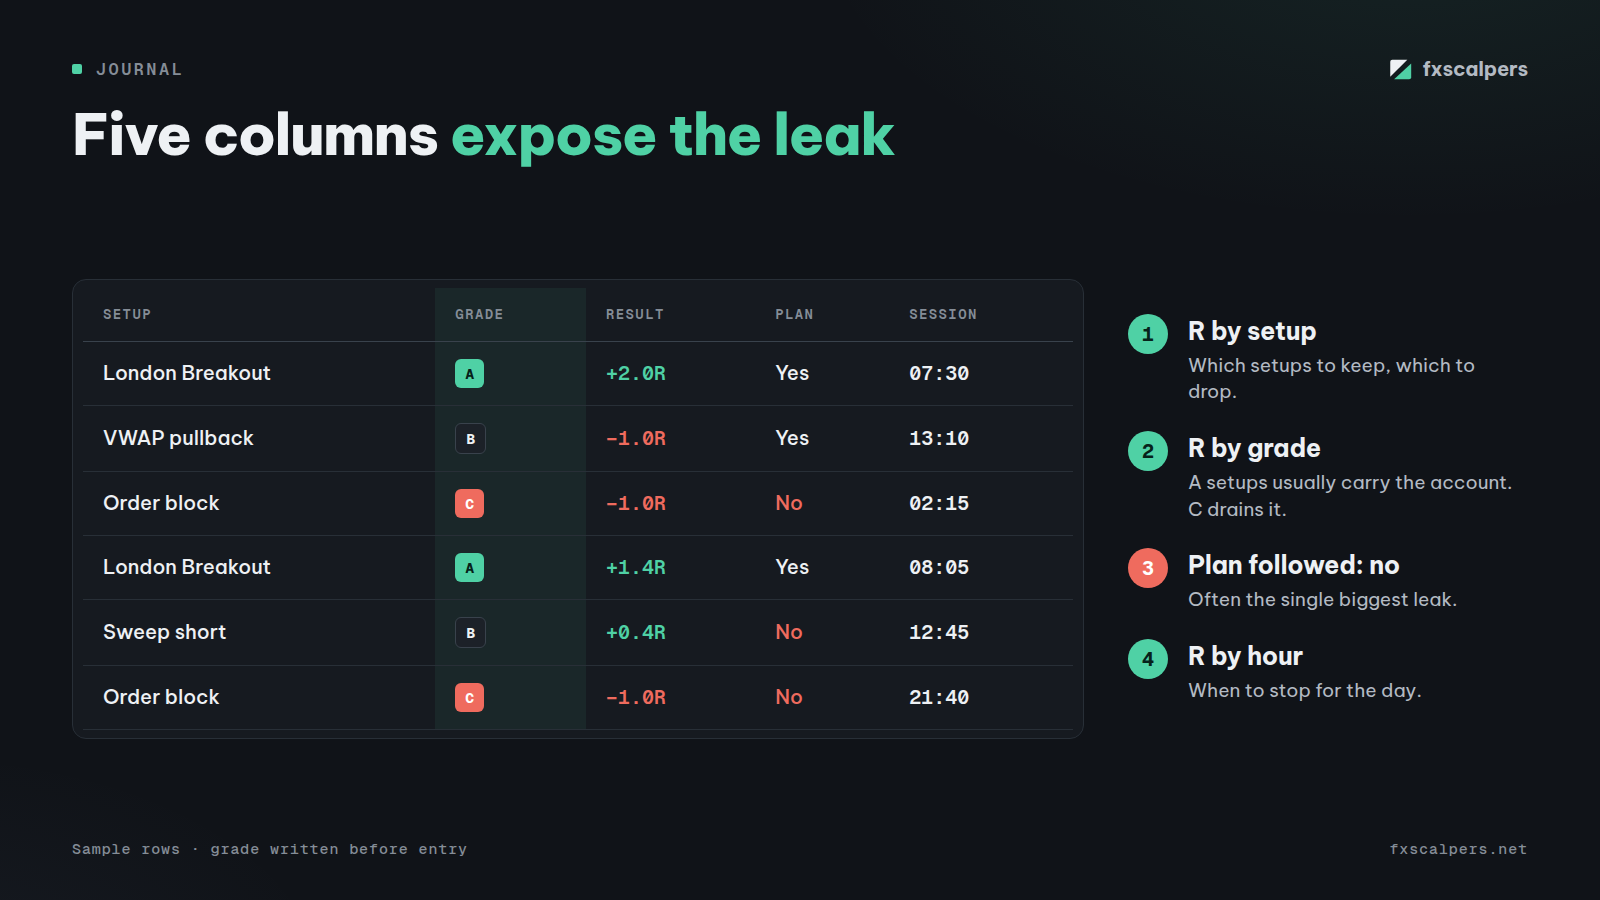
| Setup | Grade | Result | Plan | Hour (UTC) |
|---|---|---|---|---|
| London Breakout | A | +2.0R | Yes | 07:30 |
| VWAP pullback | B | −1.0R | Yes | 13:10 |
| Order block | C | −1.0R | No | 02:15 |
| London Breakout | A | +1.4R | Yes | 08:05 |
| Sweep short | B | +0.4R | No | 12:45 |
Sample rows. Five entries already hint at the story: the A-grade London trades carry the page, and the 02:15 C-grade trade taken off-plan is pure leak.
What the journal tells you after 50 trades
Fifty trades is enough to see patterns and small enough to reach within a month or two. Put the journal in a spreadsheet and total R four ways.
- Total R by setup shows which setups to keep and which to drop. Most traders find one or two setups doing all the work while three others quietly give it back.
- Total R by grade usually shows that A setups carry the account and C setups drain it. The fix is not a new strategy. It’s deleting C trades.
- Total R for “followed the plan: no” is often the single biggest leak in the whole journal. This number is the cost of discipline, in hard currency.
- Total R by hour shows when you should stop trading for the day. The late-session and after-loss hours are usually red.
A worked example
Imagine 50 trades totaling +6R. Sounds fine. Now split it:
- A grades: 22 trades, +14R.
- B grades: 18 trades, +1R.
- C grades: 10 trades, −9R.
Illustrative numbers, but a very common shape. Cutting C trades alone takes the month from +6R to +15R without learning anything new. At 1% risk per trade, that’s the difference between a flat-looking month and a strong one. The journal didn’t find a better entry. It found the trades to stop taking.
Keep it cheap to maintain
- A spreadsheet is enough. Fancy journaling tools don’t make you more honest. Five columns and a date.
- Fill it in right after each trade closes, while you still remember why you took it. Waiting until the evening means the losers get rewritten.
- Review it weekly, not daily. Daily reviews invite overreacting to noise and changing rules after one bad afternoon.
- Screenshots are optional. If you take them, take one at entry, not at exit. The entry screenshot shows what you saw; the exit screenshot shows what you wish you’d seen.
Traps to avoid
- Grading after the result. A trade that won is suddenly an A. That destroys the only honest column. Grade before you click or don’t grade.
- Only logging “real” trades. The impulsive ones are exactly the ones you need to see. Log every trade.
- Journaling in dollars. Dollar results swing with size and hide the pattern. R keeps it clean.
- Changing the columns every week. The value comes from comparing like with like over months. Keep the five columns fixed.
Pair it with rules that hold
A journal shows where the money leaks. The tilt checklist stops the leak from opening during the session, and what you do after the entry covers the decisions that turn one loss into three.
Quick FAQ
Spreadsheet or app?
A spreadsheet. Five columns, a date and a formula row for totals. Apps are fine if they don’t tempt you to track twenty things.
How long until the journal is useful?
Patterns start showing around 30 trades and are reliable around 50. That’s usually one to two months for a scalper.
This is the same journal the FXScalpers VIP reviews are built on: one look at these five columns and the leak is usually obvious. See what VIP includes, and in the meantime follow the Free channel, where every setup comes with a name and a clear invalidation level you can log straight into column one.